An Aerial Survey of Three Lakes
Published:November 2025 (2)
From coarse elevation models to high-resolution landscape insight
This post revisits the Three Lakes site using a high-resolution drone survey and photogrammetry, allowing a much more detailed understanding of landscape structure and drainage than was possible with earlier elevation models.
I have already explored the landscape history of the Three Lakes site in an earlier blog. But, as is often the case with this kind of investigation, new evidence has emerged that allows the story to be taken further.
Before doing so, it is worth briefly revisiting what we were trying to understand — and what we already knew.
From Coarse Models to Fine Detail
In April 2025 – Tracing Hidden Waters, I examined the drainage of the basin using a Digital Elevation Model (DEM) derived from Ordnance Survey Ireland data at a 10 m resolution.
This dataset is highly accurate in terms of elevation, but not particularly precise at the scale of a small lake basin. With one elevation point every 10 metres, subtle but important features of the landscape are easily missed. For modelling drainage — where differences of less than a metre can determine flow direction — this becomes a serious limitation.
The effect of resolution can be seen clearly by comparing models generated from different datasets:
The difference is striking. Features that are completely invisible at 25 m resolution emerge clearly at finer scales.
A Drone Survey Opportunity
As described in November 2025 – Coring – at Last!, we were fortunate to have near-perfect weather during the coring campaign — clear, calm, and bright. This allowed us to carry out a drone survey of the site.
The result was a very high-resolution dataset, with a ground resolution of approximately 5 cm.
This survey used photogrammetry, a technique that reconstructs the three-dimensional shape of the landscape from overlapping photographs.
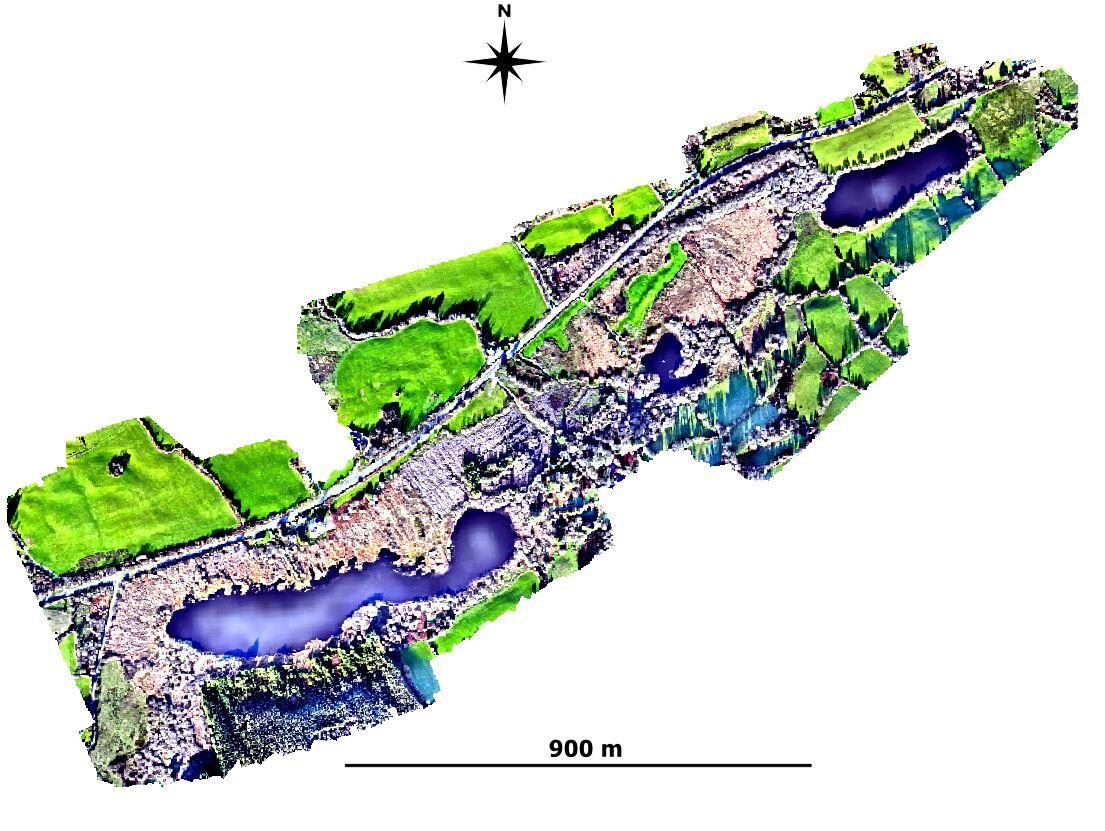
The ortho image from the aerial survey flown by drone over the Three Lakes site.
How Photogrammetry Works
The principle is straightforward. The drone captures many overlapping images of the ground from slightly different positions. When the same point appears in multiple images, its position shifts slightly — an effect known as parallax.
The amount of this shift depends on elevation:
- Higher points shift more between images
- Lower points shift less
Using the known position and orientation of the camera, software calculates the exact three-dimensional location of each point. Millions of these points are combined into a point cloud, which is then converted into a Digital Elevation Model.
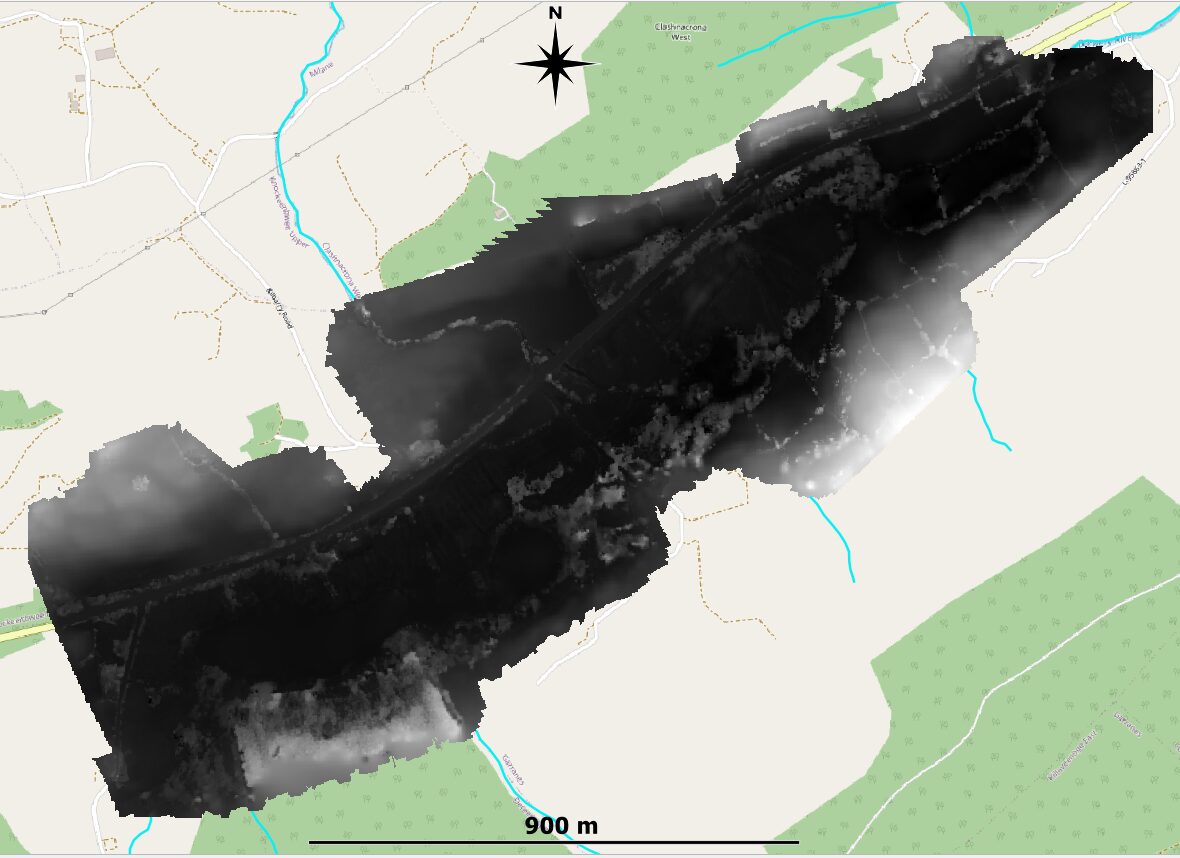
The Digital Elevation Model created from the aerial survey data of the Three Lakes site.
The Cost of Resolution
Such detail comes at a computational cost.
At a 10 m resolution, a square kilometre contains around 10,000 elevation points — easily handled by modern computers.
At 5 cm resolution, however, the number of points increases dramatically — by a factor of 40,000 — resulting in roughly 400 million points per square kilometre.
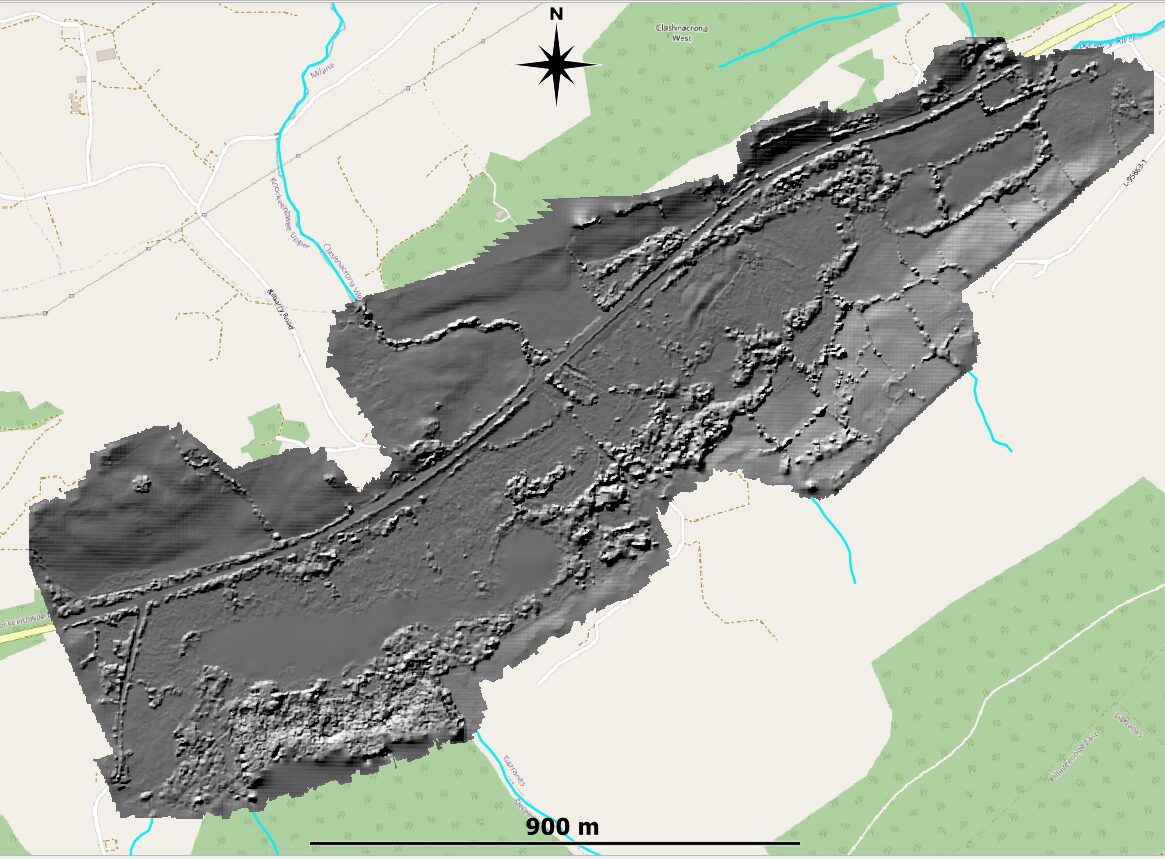
The Digital Elevation Model displayed as Hillshade.
We can use the DEM data to create contours, like these at 1 metre vertical intervals.
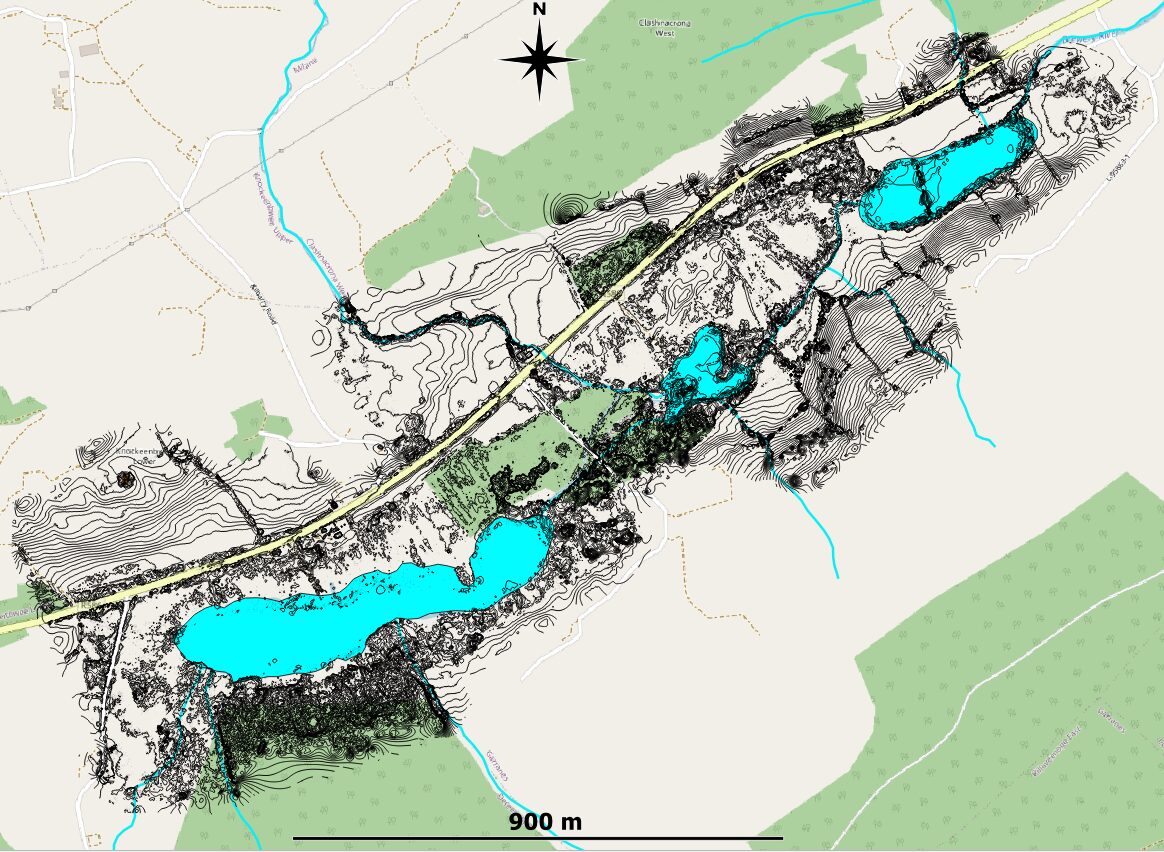
The Digital Elevation Model displaying 1 metre contours.
And we can combine these contours with the bigger - less precise - contours derived from the 10m grid DEM.
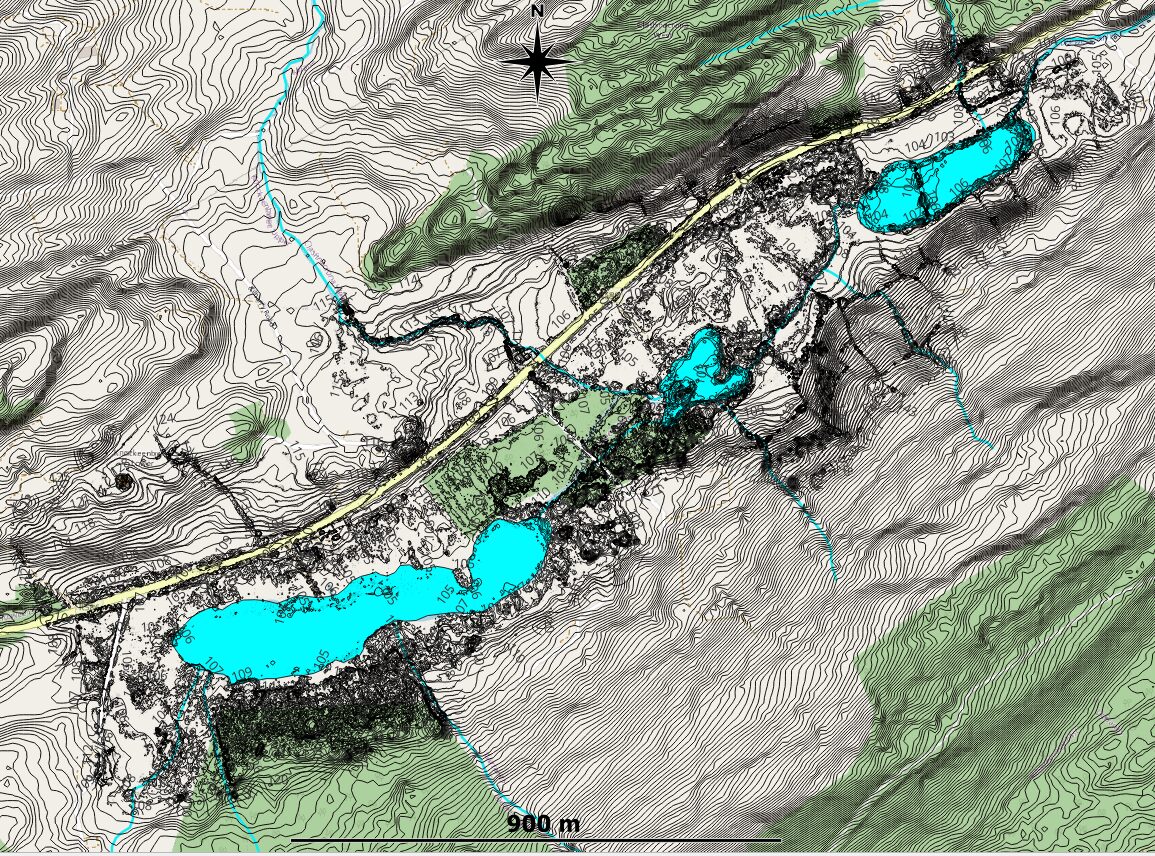
The whole area displaying 1 metre contours, those from the 5cm grid, and those from the 10m grid.
Processing datasets of this size is time-consuming, even on modern machines, and requires careful data management.
What the Drone Can — and Cannot — See
Photogrammetry captures the visible surface — effectively what the eye sees from above. This introduces an important limitation.
It does not measure the ground where the ground is hidden.
Instead, it records:
- the tops of vegetation
- tree canopies
- hedges and shrubs
- buildings and walls
- road surfaces
In areas of woodland or dense vegetation, the “ground surface” in the model may actually be several metres above the true ground level.
A second limitation arises from how drones must be flown. To comply with regulations and privacy requirements, flights must avoid buildings, gardens, and restricted airspace. As a result, the dataset inevitably contains gaps.
Even with excellent flying conditions, the survey is therefore partial rather than complete.
Lidar — The Ideal, but Expensive, Solution
The most effective method for capturing true ground elevation beneath vegetation is Lidar (Light Detection and Ranging).
Lidar works by emitting pulses of laser light and measuring the time it takes for them to return. Crucially, some of these pulses pass through gaps in vegetation and reach the ground.
This produces multiple returns:
- early returns from leaves and branches
- later returns from the ground surface
By selecting the lowest returns, it is possible to reconstruct a highly accurate ground surface, even in wooded areas.
The drawback is cost. High-resolution Lidar surveys are expensive and not always available for small, localised study sites.
Working with the Data in QGIS
Despite these limitations, the drone-derived dataset is extremely powerful when used within GIS software such as QGIS.
The density of the point cloud allows the creation of detailed terrain models and derived visualisations, including:
- hillshade models
- slope and aspect maps
- local relief models
- flow accumulation and drainage patterns
These visualisations can reveal subtle features that are otherwise invisible — slight ridges, shallow channels, or low-relief mounds that may reflect past hydrological or glacial processes.
At this scale, the landscape begins to resolve itself.
Where This Leads
Each survey method has its strengths and its limitations:
- Coarse DEMs — broad coverage, but miss fine detail
- Photogrammetry — extremely detailed, but surface-limited
- Lidar — highly accurate ground data, but expensive
The challenge is to combine these approaches to build the most reliable interpretation of the landscape.
In the case of Three Lakes, the new high-resolution data is already revealing features that were completely invisible in earlier models — and these, in turn, raise new questions about how the basin formed, how it drained, and how it has evolved over time.
The story, it seems, is far from complete.